Choose Your Own Adventure

Wednesday broke a lot of people in our building.

Last Tuesday my school board voted to close three elementary schools at the end of the year. It was the worst-kept secret in the Region as the closings had been long-rumored, generating a series of demonstrations by teachers and community members.

At the same meeting the board voted to approve layoffs for 173 employees with support staff, paraprofessionals, and custodial staff taking the brunt of the cuts.

Wednesday about half the teachers in the district woke up with a mysterious illness, causing the district to close for the day.

That afternoon the mayor held a virtual town hall and stated, “I don’t think they’re done cutting. If we don’t fix the funding problem, next year it may be Morton High School.” (46:40 mark of the video).

Morton High School. My school. Well. That’s a lot to process for one day. I have no desire to change schools again, but a year or two from now I may not have a choice.

Most of us just want to put this year out of its misery. Teachers are done with PD, kids want to get to the last week of May and get out of here.

It’s a delicate balancing act, reading the room.

In my district tests and quizzes account for 70% of the overall grade so the last thing I need is to offer my kids an assessment that will bomb their grade. But wait Mr. Dull, isn’t it your kids’ job to prepare for quizzes? I mean, if it’s that big a factor in their grade, shouldn’t they take it more seriously?

Yes, but. It’s also my job to determine the most appropriate way to assess my kids, to select a way for my kids to demonstrate their learning. In the first week of May in Algebra II, wrapping up the rationals unit, that looks like an activity. Choose your own adventure, it says here.

Enter DIY Row Games.

Row Games were a darling in the heyday of the #MTBoS. Students pair up and work a page of problems in two columns, one column for each student. Catch is, the answers for each pair of problems is the same. So the exercise is student-centered and self-checking. There’s a couple of folders of pre-made row games out there.

I grabbed one up (multi-step equations) to use as a bellringer, then set the hook: “Man, the answers to both problems were the same. All the way down? Hunh, that’s a weird coincidence. How’d the teacher that made this page do that?”

So we bounced some ideas around and eventually settled on working the problem backwards, starting with the answer and using inverse operations to work back to the original problem.

Then I introduced the assignment. (Doc here, template here). Students work in pairs to create a page of row games, one each of simplify, multiply, divide, add, and subtract rationals. They turn in a page of problems, a worked-out answer key, and the work they did to go backwards from the “answer” to the original problem.

They were tentative at first, then started to dig in. I made my way around the room to check for stuck students and demonstrate the process for a problem from the bellringer.

The big payoff came late. Students were working diligently on Day Two of the activity and making good progress but starting to sense they wouldn’t finish. The question developed independently from two sides of the room: “Can we keep working on this tomorrow?”

Wait. You guys want to do more math? On a Friday?

I don’t know….. well, maybe. OK. Fine. Due date is tomorrow.

And yes, I totally planned that in advance.

Because I’ve been doing this for a while and you learn to anticipate these things. So instead of all of us being frustrated with a traditional pencil/paper quiz over a really tough topic, bad grades and hurt feelings all over the place, I got kids so invested in an activity they want to keep working on it for a third day.

That’s a good Thursday in Room 130 right there.

Oh, and they’ll see Row Games again. I plan to take one or two of the student-made sets and use them as part of my semester review package coming up a few weeks from now. Because authentic audiences are awesome.


The coalition of state representatives from my Region put together a press release this week blaming the state GOP leadership for my district’s financial woes. (Indiana is super-majority Republican in the Statehouse so one party has great influence on education policy). You can make a case for their position on property tax caps and referendums and vouchers, just like you can question the decision-making at the local level. I spent all of last school year as a Teach Plus Policy Fellow studying the school funding model in Indiana. There’s aspects that need fixing.

But what I do know is that both of those things, state-and local-level policy-making, are outside of my control. I can advocate, but I don’t get to make laws. What I do get to do is make decisions about how I organize my classroom and plan my instruction to suit my students’ needs.

Choose Your Own Adventure. And I’m going to keep doing just that until they take my keys and lanyard away.

Should I Stay Or Should I Go

I’ve been told by teaching colleagues that I am too analytical. It’s a pretty good read. I’ve never been comfortable flying by the seat of my pants. I’d rather have as much information as I can get and have the pieces more or less in place before making a move.

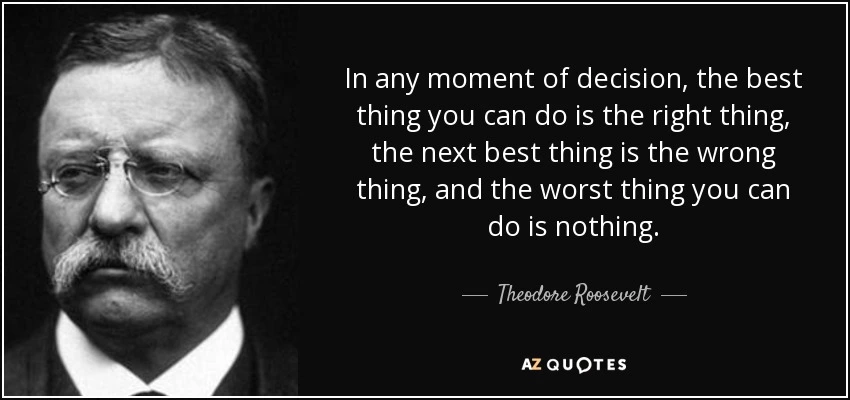
Although that one Teddy Roosevelt quote hangs behind my desk because sometimes you just have to make a decision.

It’s not always possible to have all the knowledge you need. To be honest, a key moment in my life was when I learned to operate in a grey area, when “black-and-white” is not one of the options.

Did I ever tell you about the time we bought a house sight-unseen? Moving back to the Region from Vegas, we had enough money to fly back for job interviews but not enough to come back a second time for house hunting. We did our research online (on the baby Internet back in 2005), my wife’s stepdad was our agent, we’d find a house, he’d check it out and report back. He eventually did the walkthrough of the house we selected on his flip phone while we stood in the kitchen of our house in Vegas.

Sold. We never saw it in person until we pulled up in the U-Haul.

That’s when I understood the Colin Powell 40-70 rule. General Powell felt if he couldn’t be 40% sure the outcome of a decision, that was a “no”. But he also recognized he would never have 100% of the information, so he set 70% as the threshold. Once he was 70% positive, that was a “go”.

And so it is in so many areas of life. Gather your data, assess the probabilities, move forward. It’s why the probability unit in Algebra II is so rich with opportunities for real-life connections. Yeah, we do do plenty of Fundamental Counting Principle practice, we figure permutations and combinations (“How many ways can three runners finish first, second, and third in the 100-meter dash in a field of eight runners?”)

But the big money payoff is when students see how understanding probabilities and likely outcomes can help them manage an uncertain (at best) world.

We start the prob/stats unit with a deep dive into March Madness, including a bracket challenge with their new-found handicapping knowledge.

Then out of long habit I make the assessment for the unit a pair of activities: First (because Indiana), John Scammell’s “Free Throws For The Win” .

They were like “Mr. Dull can we do something happy tomorrow? Because that was the saddest thing I’ve ever seen in my life!”

We follow that up with an investigation into the Monty Hall Problem (doc here). Both days they do real math and see the real applications of probability that they can start using really as soon as tomorrow.

The big takeaways are that even what seem like highly improbable things still sometimes happen. And that just because something is statistically your best move doesn’t always guarantee success. You have twice the probability of winning the car on Let’s Make A Deal by switching doors, but in any one play (which is all you get when you are a contestant), there is still a 1-in-3 chance you get the Zonk.

Goat 🙂

Weigh your options, and roll.

A lot of my friends in the building are making exactly these mental calculations these days. At our next school board meeting next week the district is expected to announce its decision on school closures and teacher layoffs. Consensus is we will shutter 4 of our 12 elementary schools, and we were told back in November that the defeat of a funding referendum would require cutting 250 teaching positions.

But as a colleague of mine pointed out, folks aren’t waiting. In his words, they are “RIFfing themselves”, lining up new jobs before the axe can fall. In some cases, making the move before the school year is done. We had four resignations from just my building on the personnel report last month, and I suspect the number will be similar this month. (That’s 10 percent of our teaching staff in eight weeks, if you’re scoring at home). And can you blame them? As the famous economist observation goes, when you lose your job, unemployment in your house is 100%. It doesn’t matter what the “official” statistics say.

I’ve been on the other side. Some time ago I left the district I call “the Family Business” for a green leafy suburban school. Well, the grass isn’t always greener. I came back. For the people and the kids. I took a pay cut to do it. There’s no district out there where the hallways are paved with gold. Few are paying significantly more than we are. There are so many districts (even in relatively affluent areas) in financial distress right now, it’s the living embodiment of “the devil you know”. You could jump districts and land someplace worse.

I feel horrible for the families who will have to make plans for their kids to attend a different school next year. For the kids who will leave their friends. I ache for my teacher friends who are going to be forced out of a job they’ve poured their soul into. For the clerical staff and custodians who won’t even be allowed to finish out the year. I’ve been told that due to the number of vacancies and emergency permit folks in the district, teachers with a degree and a license are probably safe. But even for the folks who are above the cut line, the daily anxiety over the future permeating my building is physically exhausting.

And the concessions that will likely be written into our contract (yeah that’s not even settled yet, five months after the state-mandated deadline to conclude negotiations) are frankly petty and punitive and are chasing teachers away. Folks who stay will get no raise and shoulder the burden of an unsustainable insurance premium increase.

Tuesday of Holy Week, this line from the Gospel of John hit hard:

Jesus answered, “It is the one to whom I hand the morsel after I have dipped it.” So he dipped the morsel and [took it and] handed it to Judas, son of Simon the Iscariot.  After he took the morsel, Satan entered him. So Jesus said to him, “What you are going to do, do quickly.”

https://www.biblegateway.com/passage/?search=John%2013:26-28&version=NABRE

That’s all of us right now: whatever the plan is, get on with it. Just tell us. Then we can take that information and make a decision.

Just like they taught us back in Algebra II all those years ago.

Lemons. And Project-based Lemonade

Being a teacher in my district in 2024 is a daily mental struggle. A protracted contract battle, threats of school closures, an upcoming reduction in teacher force, all things contributing to a morale problem the size of a volcanic crater. It’s hard to see a moment on the horizon where things turn around and get better.

Declining enrollment is the root of the problem. Fewer kids means less state money. And eventually it means you have too many employees and too many buildings.

So being a math guy and a pessimistic optimist, of course I decided to give my students access to the enrollment numbers over the last 20 years and start doing some math with it. Project-based learning and all, right?

Introducing the SCH Enrollment Investigation. (here’s my planning doc including the basic format ChatGPT spit out when I asked it to write the project for me).

I’ve got a Desmos activty examining school district enrollment I’ve been doing with my kids forever (so long that when I first rolled it out it was a pencil/paper activity). I show them a coordinate plane with five (linear-ish) data points. I ask them to create a line of best fit and write equations for the line, then use that model to predict future enrollment. Hook is, I give them five years of data that were the tail end of decades of linear growth, that leveled off a year or so later when the global financial crisis hit. Takeaway: The model is good until it isn’t. Sometimes the model is bad to start, sometimes the world changes. (Foreshadowing alert!)

In that Desmos activity I asked them to model the enrollment of a district (Clark County, NV, home to the Las Vegas schools) that was experiencing rapid growth. Now I want them to think about whether we could use a similar tactic to model enrollment in a district in decline. Pointed them to a couple of recent newspaper articles on the issues in the district and aked them to write some facts.

Then I set up a table in a spreadsheet for them and linked them to the IDOE’s giant mega sheet of enrollment by district since 2006. OK kids, go grab the figures you need for our district, complete the table and insert a scatter plot and trendline.

My motivation for this project is to get a look at exponential and logarithmic functions before we study them in the upcoming unit. So I encouraged the kids to try out different functions for their trend line and see which one modeled the twenty or so data points best.

At 30,000 feet (the Google Sheet chart) the four types of functions don’t look all that different, so Tuesday when we get back together I’m going to give them a quick look at a Desmos graph of the 20 or so data points, and the trend lines for exponential, logarithmic, and polynomial functions.

One of these things is definitely not like the others. Those last four data points are the post-pandemic, post-consolidation years. There are a couple of other contributing factors, but what I’m hoping my students will see is the model is broken, and then I’m hoping that will get them asking questions.

I also linked them to a demographic study our district commissioned after two elementary closings but before we consolidated from four high schools to two. I’m asking them to compare the real-life numbers to the projections of a paid professional.

My hope is this underlines that such reports are built around a specific set of assumptions, and sometimes the world changes. That doesn’t mean the researcher didn’t know what he was doing, or that the numbers were bad.

The culminating event of the project is a student presentation sharing their findings and including their recommendations for the district.

As part of their work I asked them to think about why they thought the enrollment was shrinking in our district. They gave it some serious thought:

Others mentioned increasing housing costs in our city and families seeking new districts due to school closures or seeking in-person school during the shutdown.

They are on this, folks.

I suspected they would connect with this activity because it is 100% real to them right now, and that connection has played out. The last thing I want (or need) to put a bow on the project is a community partner, someone who could come to the classroom and answer questions from students (why close that school? what if we kept more kids/families from leaving the district? is there a way to keep more teachers and still cut costs? why doesn’t the state provide more funding? can the city do anything?)

Real data is messy. Which is why I love it. Giving kids a chance to math with real numbers that really matter to them is absolute gold. Can’t wait to see their presentations this week.

Uncharted Waters

Announced Evaluation Season is wrapping up in my building. I sat with my principal for our pre-conference the week after Thanksgiving, and I was upfront with him that I was in uncharted waters – I knew what I had planned but I had no idea what he would see the next day.

We are in Year Three of a conversion to a project-based learning school, and though I have plenty of experience with problem-based learning through Three-Act Math, I hadn’t taken the plunge on a full-on project until this year. In fact I was scheduled to be observed during Day Three of the project. No not a “traditional” class session by any stretch.

I’ve got a stack of second-semester projects from a previous go-round with Algebra II but I was searching earlier this year for something I could roll out earlier. I stumbled across a timely topic that peaked my interest and I hoped would make sense to my students as well: a debate project from Next Gen Personal Finance titled “Should Municipal Bonds Fund Stadiums?

The Chicago Bears are pondering a move to the suburbs and presumably would be seeking some level of public support for a new stadium on the former Arlington Park property, although there is a late push for a stadium site in the city. And the state of Nevada recently approved $380 million in funding for a new stadium on the Las Vegas Strip for the former Oakland A’s. The ballpark is facing stiff opposition from teachers’ unions who say the state can’t afford to give away millions to an out-of-state billionaire while the schools in Nevada go underfunded.

So there’s plenty of current coverage of the stadium public-funding issue to go along with multiple links in the source document, which I edited a bit for our class purposes.

I opened the intro day with a quick piece of video:

We talked a little bit about what kind of things cities pay for with tax dollars (student replies included public safety like police and fire; parks and recreation, health care, and education). Then they dug into a few of the links provided in the document to get a basic understanding of the issue. They took notes on articles that opposed using public funds for pro sports stadiums.

By Day Three, my observation day, they were ready to generate supports for the argument in favor of public funding. It’s a tougher ask. There are fewer articles out there in favor. But I had hinted at the Bears and A’s stadium discussions, so they were not fumbling around completely in the dark.

I had an ace up my sleeve. With my principal sitting in the back of the room, I asked them to come up with reasons they would be opposed to our district’s new “no cell phone” policy. They were a bit reluctant to speak out with an administrator in the room but eventually opened up.

  • “We concentrate better when we can listen to music during math”.
  • “It’s how we communicate with family and friends”.
  • “Some of us have health or productivity apps on our phones.”

Not bad. Then I asked them for reasons folks might be in favor of a ban. Three students replied in unison “distraction”!

I explained that they just recreated a simple version of the debate that took place amongst our board of school trustees last spring before the ban was implemented, and that was the process that adults often used to work through contentious issues.

I had tipped my administrator that rather than assessing a content standard, this project was based on a standard of mathematical practice, SMP 3 (“construct viable arguments and critique the reasoning of others”) and he just saw me hook my kids in with a relevant example in real time.

And they were hooked. Over the next few days of the project they dug deeper for additional supports on both sides. They split into two teams of five students each to organize and rank their top five supports, and also to anticipate their opponents points, and to decide how to counter those supports. I selected two students to act as judges.

Come debate day, they were ready to go.

Many of my students leaned into the opportunity cost of stadium funding, coming at the expense of education and other needs. It’s kind of a touchy subject in our district right now. They did a fantastic job researching and building arguments, and were able to insert their supports at appropriate moments in the debate. The following day was set aside for reflection, and they all felt that they were well-prepared for the debate and that they helped their team’s side with their efforts.

They also prepared to present their findings to the community at our New Tech Winter Showcase this week.

This debate project was a new experience for my kids, and for me. I’m not new to risk-taking in the classroom, but I think we all get a little twinge of nerves on observation day. I haven’t seen the outcome of my evaluation yet, but I feel like we both exceeded expectations this week.

And I’m already planning our next project. Gonna talk school enrollment trends and school funding. They’ll crush it like a belt-high fastball.

Plane As Paste

It started (as most things did in the naughts/early teens) with an xkcd comic. (The actual title is NSFW).

Source. Used under CC BY-NC 2.5 DEED

Then the internet’s most brilliant math-teacher-minds got ahold of it and Pomegraphit was born.

There was definitely a minute where coordinate plane things were all the rage amongst my online PLN.

Spend enough time with algebra teachers and the conversation turns deficit model: “They can’t even plot a point?” Which might be followed by “But with Desmos they don’t have to.” Maybe that makes this type of exercise even more valuable than it was when it originally rolled out. Here’s Dan Meyer when he wrote about the process of developing the Pomegraphit activity:

gridded plane is the formal sibling of the gridless plane. The gridded plane allows for more power and precision, but a student’s earliest experience plotting two dimensions simultaneously shouldn’t involve precision or even numerical measurement. That can come later. Students should first ask themselves what it means when a point moves up, down, left, right, and, especially, diagonally.

https://blog.mrmeyer.com/2017/pomegraphit-how-desmos-designs-activities/

Then: I somehow stumbled upon Lucas Kwan Peterson, the food writer for the LA Times. I think this might have been the tweet that sent me on the quest:

His shtick is ranking categories of things on a coordinate plane – spicy snacks, Halloween candy, fast-food french fries, Girl Scout cookies. And I saw an opening:

What does it mean to be further right on the x-axis in this image? Higher up on the y-axis? And now it was plain as paste. Or, plane as paste, pardon the pun.

And in the days of teaching Algebra II from my dining room table, the Spicy Snack Desmos activity was a hit with my remote learning kids.

But since then, I’ve wondered: could we do more with it? Could my kids create their own Peterson-style coordinate plane ranking, of a subject of their own choosing? Then I switched to geometry and the question kind of went on the back burner. Until this year when Algebra II was back on the menu and I needed a next-to-last-day-of-the-quarter activity.

Got it. Went and dug up the 1.0 version of this activity I made for an e-day a couple of years ago. Made some edits and refined the questioning (one of my ongoing areas of emphasis for myself, especially post-pandemic).

And I rolled out The Coordinate Plane Power Rankings activity. I wanted students to come up with their own characteristics for the x- and y-axis labels, and to be able to insert photos and text of their items, so Google Slides was the right home for this activity.

I showed them Peterson’s Spicy Snacks graphic and asked the FH Doritos vs. FH Cheetos question, got some positive feedback on their understanding of positioning, and challenged them to create their own Coordinate Plane Rankings, using a topic of their own interest:

They jumped in and as I made my way from table group to table group I was able to peek over shoulders, encourage, ask clarifying questions, and just in general enjoy watching my kids create.

We had about an even split between kids who identified two strong and somewhat unique characteristics for the rankings, and those who just kind of stated the same idea twice. But they had strong feelings when they wrote their justifications for the rankings and I knew I had a good hook. We can always go back in and tweak the math understanding part after the fact, right? Even in a 45-minute class.

I had one more question to ask, as an extension. We looked at Peterson’s Fast Food French Fries graphic and write-ups, noted the shape of the grouping of points and:

We ran out of time to give this one the attention that it deserved. The categories were “texture” and “taste” and I was hoping they’d see how closely related the two descriptors were – like, it’s really hard to have a good-tasting fry with bad texture. That’s either a chip, or mashed potatoes. A location deep in the second or fourth quadrant doesn’t really make sense here.

But a couple of the kids who focused on music got the basics. Did you rank a song that had great lyrics but you didn’t like the beat? And the world is full of bangers that one day you look up and say “Wait, what did they just sing? Uhhhhh…. yikes”. In some categories that’s possible in a way that the fries relationship isn’t.

Also: everything he said about Del Taco is gospel truth:

Last time I had them I was sitting in the front seat of my car in a grocery store parking lot just off the 95 in Vegas and I’m not sure but I thought I faintly heard angel choirs singing.

One last thing: we’re in our third year of a conversion to a project-based learning school so we’re always seeking out community partners and/or an authentic audience, and even tho I haven’t made a #teach180 post in years I still love bragging on my kids on social. So I shared some of the day’s work and tagged Peterson in the tweet.

And this happened:

I agree. And thanks.


One other teaching/coaching-related thought: our evaluation rubric language has changed in the last couple of years, leaning heavily towards student-centered/student-focused classrooms as our exemplar. I definitely saw my kids taking control of their learning during this activity, creating a document that relied on understanding of concepts and then interpreting the graphs they made (evergreen algebra state standard). And we used a real-world example of the type of work I was asking them to do so they had an idea of what the final product could look like.

Those are good days in the classroom. Fun days. Fun with a purpose. I’ve got a few more things in the tank that will keep moving me in the direction we want to be as a staff and as a building, and hopefully keep my kids curious about math.

And if this post made you hungry, go check out Peterson’s take (inspired by the success of The Bear) on why it’s hard to get real Italian Beef outside of Chicago. And don’t skip on the gravy or the giardiniera.

The T-Shirt Shop

Plenty of things have changed about my day-to-day with my shift to instructional coach in my building, but one constant is my attitude about creating and sharing materials. I’ve been sharing everything I make with my geometry colleagues the last two years, and I’ve continued to push resources out to my fellow algebra II teachers this year.

It might even be more imperative this time around. Our district shifted from an A/B block schedule to a traditional seven-period schedule this year, meaning everyone’s plan time has been cut in half and they’re seeing twice the amount of student work per day. Creating problem-based activities is probably pretty far down the list of priorities. Sound like they could use a partner in that effort.

Someone to set the table.

Julie Reulbach’s linear inequalities discovery lesson has been floating around in my head for a while. Meanwhile, our Algebra II team is beginning the year with Unit 3 (Linear Systems). We recognize the need to support our students with review in graphing and solving equations if we’re gonna jump right in to systems first thing. And we are in Year 3 of an ongoing conversion to a project-based learning school.

Taking all those points into account, my solution was to build a problem-based activity (think Three-Act Math) around Reulbach’s work. Thus “The T-Shirt Shop” was born. (Documents here, here, and here).

The scenario was students reseraching costs for t-shirts and hoodies to be sold as a fundraiser for a student group. In our set-up, a community organzation in Hammond had donated $2000 to cover the costs. My kids dove right in, brainstorming “knows” and “need to knows” and posting them, so that the group could share the collected knowledge. Then it was off to Google “t-shirt printers” and spend some imaginary money.

It was about this time that one of my students (returning to me from geometry last year) asked, “Hey Mr. Dull, this is cool and all, but when are we gonna do real math?”

My two big takeaways:

  • Real Data, chosen well and used well, hooks students in like no textbook or worksheet problem can
  • Real Data is messy, and sometimes that serves as a hurdle to doing the math we’re focusing on in class

Once they had prices in hand, their job was to determine combinations of t-shirts and hoodies that would cost exactly $2000, combinations that would be less than $2000, and combinations that they could not afford because the cost was more than $2000. They recorded these on paper and then entered them to a Desmos graph I had set up in advance and shared to them through Schoology.

And here’s where things kind of went off the rails. The “real math” they were asking for a minute ago? I had to provide plenty of support when it came to writing an equation of their “exactly $2000” line. Which cost us time, and kind of took away some of the power of the reveal when I changed the equals sign to “less than or equals”. And they had trouble articulating the significance of the dots in the shaded region.

Once I helped them see what they were seeing I asked them a series of reflection questions to close out the day, so they could put in words what it meant that the dots were above the line or below the line, and set the table for next time when we’d use this process on paper to solve systems of linear inequalities.

Part of the New Tech model is grading using a rubric of some of the NTN Learning Outcomes. I selected Knowledge and Thinking, and Collaboration. I was looking specifically for them to use multiple representations of the data (table, graph, equation), to understand and express the significance of the points in the shaded region or outside the shaded region, and that they participated in the brainstorming and research.

I’ll count the two days as a partial success as we introduced the problem-based learning model we’ll use throughout the year, and used one of our go-to sites in Desmos to meet the state standard of graphing with technology. I’ll keep building in supports for the “actual math”.

And now that I’ve taken a test drive I’ll keep my eyes out for one of my Algebra II colleagues who might want to roll it out in their class. With my full support, of course.

On The Flip

Michigan sunset ahead of an advancing storm

Snuck away for a long weekend to get my head straight before Back To School. Those 9:00 EDT sunsets in late July they got in Michigan are pretty sweet. But the world turns and things change.

That’s life on the eastern edge of the Central Time Zone. But wait, there’s more.

Abby Weppler, meteorologist at WSBT in South Bend (an hour east of me but roughly the same latitude), shared this the other day:

More than an hour less daylight by the end of the month in Northern Indiana. Things change rapidly aound here this time of year.

My teacher work days are the end of next week and students return on August 14. And for the first time since the remote learning year, I’ll be teaching Algebra II. In 20 years in the classroom I’ve never taught the same course for more than about 4 years in a row. I’ve flipped back and forth between Algebra I, Geometry, Algebra II, credit recovery in various forms, Project Lead The Way. I don’t mind the shuffle. Honestly, it keeps me fresh.

What it does mean is I’ll have to update my materials since the last Algebra II class I taught was designed for remote learning. I’ve got the course built in Google Classroom but it only exists digitally. I don’t have paper materials of any kind, those all went away with my last change of district. I’ve got a line on putting fillable notes and practice sets and review/quiz problems in place, and I’ll also need to update my lesson notes slides in Quizizz. Which (coincidentally enough) I attended a webinar this morning to get a certification in Quizizz. It’s good to go back and be reminded of some of the features in that platform.

It also will dovetail nicely with our continuing transition to Project Based Learning. I have a stack of slides-based activities I used as assessments the last time I taught in-person Algebra II and it also gives me the opening to re-introduce Desmos Art. Which led to a fruitful conversation with some of my Twitter teacher friends last week. (Yeah it’s still Twitter in my world just like it’s still the Sears Tower. Sue me.)

There’s ongoing cleaning and repair going on in my building as the summer winds down so that’s going to limit our ability to get into school and work on things early. Any prep will have to happen from home. We’ve got two work days in the building so classroom stuff can happen then. In the meantime I’ve reached out to my colleagues in the department to plan together and share project or activity ideas. I can feel the onset of the new school year in the pit of my stomach but just like always, it’s a good nervous. The nervous that comes with a desire to do your job well.

Let’s go.

When The River Runs Dry

Donna And Buzz
Conceived Without Sin, Bud MacFarlane Jr., St. Jude Media.

“… he with blind faith, feeling nothing; she with visionary faith, feeling everything.”

For me it’s both. Sometimes in the same week.

I started Holy Week at my parish’s 24-Hour Prayer Vigil. I selected an intention card submitted by a parishioner who attends our Spanish-language Mass. The intentions were universal tho: Peace for the world, and prayers for the kids in the family, especially that they would find the faith.

I prayed the Sorrowful Mysteries kneeling before the Blessed Sacrament in our chapel. Meditating on the events of the Passion. It hit the depths of my soul. I was as emotionally engaged in prayer as I have been in a long time. Adoration has that effect on me in general, but this was unusually strong.

Later in the week I took my youngest son to Notre Dame for an afternoon. We’re not alums, or even subway alums, but when you grow up in Catholic schools with nuns for teachers and the most famous Catholic university on the planet an hour away, that “thing” for Our Lady’s university never really goes away. It was a popular choice for dads and kids during spring break I guess, since we were far from the only family wandering around campus, snapping photos of the Golden Dome and the Hesburgh Library.


What I really wanted to see for myself tho was Sacred Heart Basilica and the Grotto. We walked through the heavy wooden doors of the beautiful church, selected a pew, let the organ music settle over us, knelt, and began to pray together.

And I was dry. Couldn’t feel a thing. Same story at the Grotto. I’ve literally waited my entire life to kneel there and light a candle and pray an Ave, and… nothing.

Doesn’t mean the prayers aren’t useful. Don’t believe me, take the words of a saint instead:

“In you, today, he wants to relive his complete submission to his Father,” she wrote in 1974 to a priest suffering his own spiritual blackness.  “It does not matter what you feel, but what he feels in you . . . You and I must let him live in us and through us in the world.”

David Scott: “Mother Teresa’s Long Dark Night“, chapter 17 in The Love That Made Mother Teresa (Manchester, NH: Sophia Institute Press, 2013): 107-113

“Through us in the world.” Hmmm.


I feel that dryness with Twitter right now. I kind of live in three worlds there: I follow a lot of sports stuff, and a lot of political/news stuff in addition to all my teacher connects. There’s some overlap, of course. Some of it lifts me up right now. The Notre Dame women winning the NCAA basketball championship, for example.

Or an epic thread of priests and lay folks pondering the Easter Vigil. (Seriously, click through and read it. All of it. This nonsense I’m writing will still be here when you get back.)

But the Teacher Twitter stuff…. I’m scrolling right by lately. I glance, maybe. I go, “oh, yeah”, and then I move on. Or worse, I read it and go “ugh”. Truthfully, there’s a lot of stupidity out there in the Twitterverse. None of this is new by the way, just seems to be weighing on me with a little more force these days. People treat each other like crap. Political divisions are leading to derangement. Plus, unoriginal putdowns spread like dandelions. I enjoy a little snark as much as the next guy but everything is only so funny after the 100th time you read it. All of that led me to declare a one-day social media fast for myself on Good Friday. (That is a link to the past as well: tradition amongst my group growing up was all TV and radio was silenced from noon until 3 pm on Good Friday. Not a bad habit to revive, I think.)

I’m getting ready to present at a couple of Summer of E-Learning conferences in June. That has me focused. My two regular chats are always a learning experience. Those things energize me. But mild social media addiction aside, sometimes I feel like I could take or leave the rest of it.

Maybe it’s just the lull of Spring Break, getting mentally ready for the stretch run. (39 school days left, not that we’re counting or anything). Did my brain intentionally shut itself off to teacher stuff online, both to clear space for Holy Week observances, and to clear the mechanism for the fourth quarter? Maybe I’m supposed to be turning my attention outward, go “all-in” on my classes so that the world, my students in particular, can see what I’m really about.

I have the final quarter planned out. We’ve got some cool stuff coming up in Algebra II, for real. The last 9 weeks of the last required math course my students need to graduate can feel like a long march through a parched desert. I’m hoping for spring storms to hit and rush through a dry creek bed, turning everything green again.


13445660_10208570743358940_730817737376220127_n
Me and Sam at The Narrows, Zion National Park, summer 2016. Splashing around in the Virgin River is a great payoff on a 107F afternoon.


College of Arts and Sciences

Growing up, every Tom Cruise character was that super-confident, super-cool guy that could bluff his way through any situation with quick wit and a smile. Who didn’t want to be Joel Goodson or Brian Flanagan or Maverick?

But I definitely also had an appreciation for people who planned every move with military precision. Who could see the downstream consequences to actions that everybody else missed. See: Jane Craig in Broadcast News. So: going by the book, or flying by the seat of our pants? Painting by numbers, or just making some happy little trees?

Image result for bob ross memes

Is teaching an art, or a science? If you’ve been around the game for awhile, you’ve probably concluded it’s both.

Joshua Eyler of Rice University turns the question on its head in a 2015 blog post, proposing that “the most effective teaching is that which helps students learn to the greatest extent possible”.

So how might we change the art vs. science question to reflect this positioning of learning?  Though we’ll have to sacrifice the nicely compact nature of the original, a new version of this question might ask whether achieving a deep understanding of how our students learn (both in general and about our fields) is more of an art or a science.

The sorts of collaborations with students that might reveal this knowledge could certainly be called creative and even artistic.  I also think there is something of an art to being attuned to students’ individual approaches to learning (or their Zones of Proximal Development) and adjusting our strategies and techniques accordingly in order to ensure we are helping as many students as possible.

What about science?  I have to admit I’m biased here.  As someone who is writing a book on the science of learning, I lean more heavily in this direction.  Because learning has its basis in the neurobiological mechanisms of the body, I think science has much to teach us about learning.  Learning is also rooted in the social world as well, so the fields of sociology and psychology provide further opportunities for understanding.

Brain science and psychology and making adjustments on the fly for what our students (collectively or individually) need at the moment? Yeah, that sounds exactly like what teaching is. “All Of The Above”.


That was us a couple of weeks ago. I know the look I saw on my kids’ faces after the logs quiz. It’s never a good sign, but that “I don’t get this and math is stupid and I quit” feeling in February makes for a long last 13 weeks for everybody involved.

So I called an audible.

I’m hardly the first to roll out this activity. My favorite instructional coach was doing Barbie Bungee before I was even teaching, long before Twitter and Desmos had even been thought of. The great Fawn Nguyen and Matt Vaudrey have raised it to an art form.

But I gambled that it would be just the antidote for the Math Plague that was threatening to decimate my classroom. Plus, worst-case scenario, I could justify it (at least to myself) by saying that the linear concepts and DOK 3 activity would be ideal for my students in the weeks leading up to ISTEP re-testing season.


I leaned heavily on Mr. Vaudrey, who is kind enough to post his materials for anyone to use, and to reflect on his own lessons so that folks downstream might be able to anticipate the stumbling blocks for their students. I teach in the new STEM wing of my school, in what eventually will be a combo computer lab and build/makerspace. So I had some essential ingredients on hand: measuring tools, lots of space, and plenty of surfaces at a variety of heights. What I didn’t have on hand, I sought out: eight bags of #32 rubber bands at WalMart, and 8 WWE wrestling figures from my son’s collection.

Day One I tried to hook them in with an insane missile silo bungee jump, then set them up with a figure, a bundle of ten rubber bands, a data collection sheet, and let them go about the business of jumping.

Perfect world: each group of three or four students would have had about 8-10 data points. Reality: most got 4-5. Several got only 3, and one group managed to record only one distance. Those guys are gonna need some extra support.

BB Blog 2

Day Two, time for some estimates backed up by math: How many bungees would be needed to jump off the top of my projector? How far a jump could their figure make with 25 bands?

And in one of those glorious moments of teaching, I had set the hook. Students were madly pouring over their data, trying to use it to give legit estimates to the questions.

BB Blog 1
Teamwork, baby. Teamwork.

(It was about this moment that I decided that I would honor their efforts at thinking and reasoning and doing actual math on their own by entering some points for the three-day project as a quiz grade. By department policy quizzes and tests account for 75% of a student’s grade, so a good quiz grade is like finding a hundred-dollar bill on the ground outside your classroom.)

So we dumped data into a Desmos graph, let some groups with few data points share some numbers from other groups (that’s that extra support we talked about), made a trend line, set a horizontal line at 533 cm on their graph, and talked about how many bands they’d need to safely make a jump from the top of our two-story Robot/Quadcopter Arena.

BB Hlog 3
Letting Desmos do the heavy lifting to free up brain power for thinking.

Quick group huddle to compare numbers, then after a few minutes of table talk I stopped to see each group, ask about how they came up with their number, and (this is key) have them agree on one number, write it down on their page, and circle it.

Day Three, the Tournament Selection Committee has announced the pairings, and the teams are ready to jump.

BB Blog 4.jpg
Not that I’m craving attention or anything, but yeah, I totally posted the brackets on the window of the arena that faces a heavily traveled hallway.

I pre-assembled strands of ten bands to accelerate the assembly process, then students built their bungees and gathered, two teams at a time, on the second floor. We quickly found out that everyone in my 2nd hour class had seriously miscalculated the number of bands they needed. Fig after fig crashed to the floor. Lacking other options, and wanting to avoid the buzzkill of a six-way tie for last, we finally decided the “less dead” fig would move on.

The afternoon class seemed to have had some better estimates and we had some competetive matchups, as well as some gamesmanship as some teams attempted to scrunch two or three bands together in their hand on the railing to avoid a figurative skull fracture (high school kids, right?). The extra-long bungees in 2nd hour made a great math conversation starter (“what happened, you guys?”). I used Matt Vaudrey’s feedback form, and found out that Barbie Bungee was a near-unanimous hit.

Barbie Bumgee Feedback

Would this three-day activity had made more sense back in September when we were doing linear stuff? Probably. Would I have had the confidence to step back from the curriculum map for a minute when my students needed a breather if I hadn’t been hanging out on the periphery of the #MTBoS with its brilliant minds and fantastic lessons and activities? No way. Would I have tried Barbie Bungee without being able to follow a well-worn path? Not sure. I’m down with taking chances in the classroom, but I’m not sure I’d have been wise enough to add the Desmos piece if Vaudrey hadn’t blogged about it. And that made the whole project. We’d have been dead in the water, guessing a number of rubber bands for the Big Jump without it. Which means we would have missed the math altogether.

What I do know is: my students bought it, real learning happened, we all got the stress relief we needed, and I came out looking like an improv artist taking a prompt and making comedy gold.

Brian Flanagan would have been proud. Jane Craig too.

Art. And Science. It’s a Both/And.


Linear Systems Stay and Stray

Systems. Ugh.

 annoyed hate frustrated ugh jack nicholson GIF
Source

My very first go-round at systems of linear equations and inequalities, lo those many years ago, was an eye-opener. I was ready to drop the quiz score, all the scores were so bad. Clearly I must have done a terrible job teaching it. I’ll take the hit for this one, I figured. I related my misfortune to a colleague who had a couple of years experience under her belt. She wrinkled up her face and said, “All algebra I students are bad at solving systems. It happens every year. Don’t drop the quiz.”

Turns out, she was right. Truth: When you find a wise teacher, trust them.

My Algebra II students are struggling more than usual this year though. I covered another teacher’s IED class for a couple of days at the start of the unit, leaving one class of my students with a sub and some pretty thorough video notes, I thought. My first real try at an in-class flip. Thud. But my live class struggled too.

Scale of 1 – 10? They gave themselves a 3.5. No bueno.

So, let’s back up. We need some practice opportunities and a shot at understanding, not copying. We spent an entire class period working thru homework questions and setting up a word problem. That moved the needle a little. Got them to maybe 5. Still room to improve.

Sounds like a job for a Stay or Stray gallery walk. Picked this one up from my instructional coach in Hammond, Rhonda Fehr.

I provided a 9-question practice set, split 3/6 between graphing and substitution. Students group up, take ten minutes to work through problems as a group while I circulate to help troubleshoot. Each group should now have one problem on lock. My job is to subtly notice which problem that is, and assign it to that group as “their problem”. Now they put their work on a piece of poster paper which I strategically place around the room. One student is the “answerer”, the other group members ask questions to get to the point where they could teach it to other groups as they rotate around the room. Now one stays, they other group members rotate to the next station. After each round, a new student (not from the original group) stays at the station to become the new answerer, while everybody else moves on to ask questions at another station.

It was hectic. It was loud. That definitely turned off some of my students. “Mr. Dull, they don’t know what they’re talking about.” “I didn’t learn anything from him”. “We didn’t have enough time to figure out a problem/ask questions/make our poster”.

I wanted to give them an opportunity to learn one problem deeply, know it so well they could explain it someone else. I didn’t hit everyone. Maybe just a few in each class. But I posted the original problem set on our Canvas, with a worked-out answer key, and several committed to going home and at least trying the rest of the problems.

So some learned today by explaining to others. Some learned by being taught by peers. Some will go home and get in some reps and check their own work, and learn that way.

I’ll take that.